Century
Link IP Network Statistics User Guide
This guide
provides information on how to access and use the PTAP CenturyLink
IP
Network
Statistics screens. These screens are available to any user, no roles are
required. These screens are accessed by selecting
the “IP Network Statistics” tab
for Internal, Networx and QControl
users. Public users are automatically on
the
CenturyLink IP Network Statistics screen and no tabs are shown.
The CenturyLink IP Network Statistics screens provide active
metrics data for each
of the CenturyLink backbone POP circuits. The metrics data can be viewed in the
following formats:
- Summarized by current day,
prior day, prior week or prior month for a specific
POP to all other POPs in/out of the POP
continent. This can be done for the
MPLS Backbone and the ELine
Backbone.
- Detailed metrics by current
day, prior day, prior week or prior month for a
specific POP to each and every other POP within the same
continent. This
can be done for the MPLS Backbone and the ELine
Backbone.
- Run a real-time ping test
between a POP and another POP
- Run a real-time ping test
between a POP and an IP address or domain name
The Dashboard
provides the user with many ways to retrieve backbone active statistics
data in different formats and run real-time active tests. The different capabilities in the
Dashboard moving left to right are:
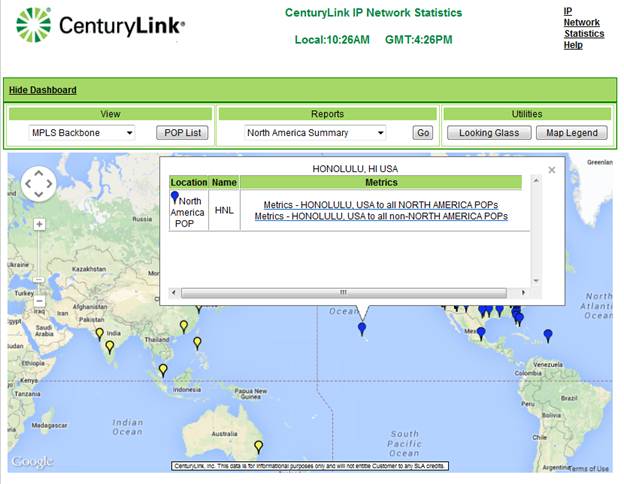
- POP type dropdown list; The
user can select to view either the MPLS Backbone,
Eline Backbone or use the Backbone Utilities. Once selected in the dropdown list,
the POPs on the map automatically change.
Each POP can be selected on the
map and a popup shows each of the different functions that can be done on
that
POP for the type selected in the dropdown.
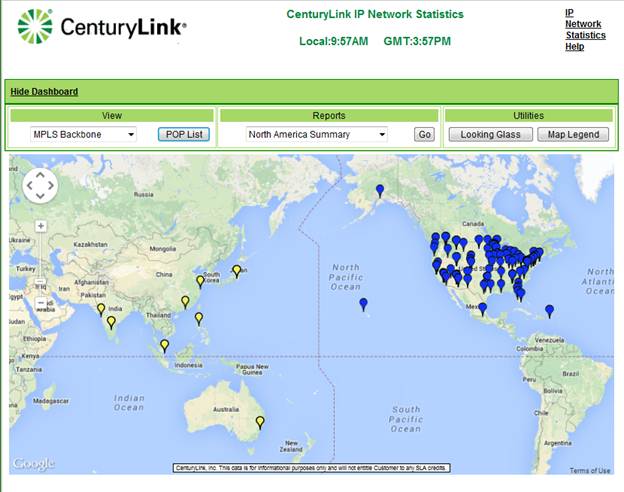
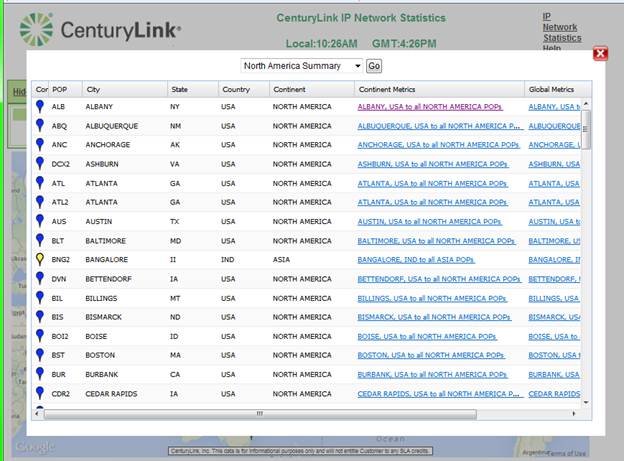
- POP List; The user can view the
POPs in a list rather than on the map for the type
of pops selected in the dropdown list.
The list is sortable by using the column
titles making it easier to work with if looking for
certain POPs.
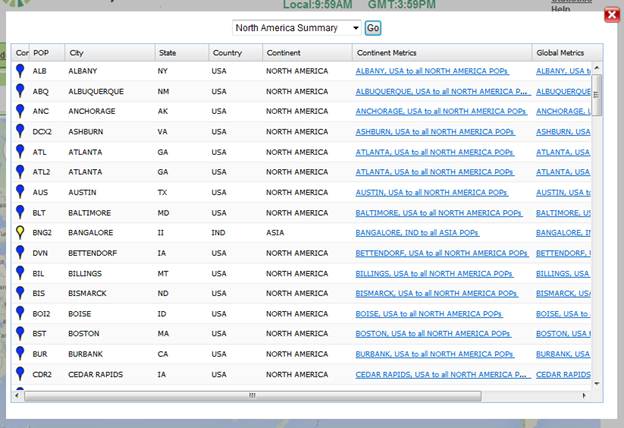
- Summary Reports; The user can
view summary reports for each continent: North
America, Continental North America (excludes non-contiguous states),
Europe and
Asia.
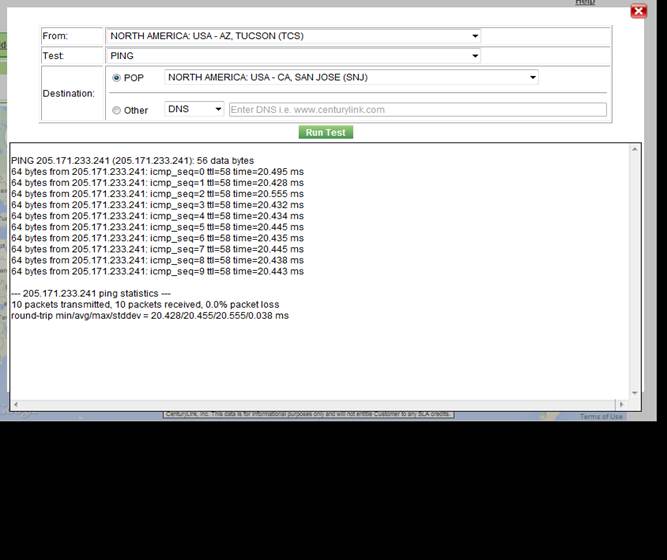
- Looking Glass; The user can
perform a real-time ping test between two backbone
POPs or between a backbone POP and an IP address
or domain. The different
types of tests are: ping, traceroute
and BGP. The IP address or domain can be
any
provided by the user.
It is possible that the test will fail because the input IP/domain
does not allow real-time pings. Shown
below is an example of running a real-time ping
test between two backbone POPs.
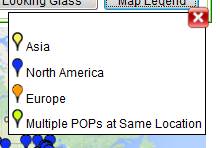
- Map Legend; The Map Legend
define the color codes for the marker on the map.
Note: it is possible that multiple POPs are at the same location.
Active
metrics for the backbone circuits can be obtained two ways: either using the
map
or the POP list. The map is useful for a geographical view,
viewing approximately where
POPs are
located. Using the
list useful if looking for a specific POP. To get to the
detailed metrics screen either:
-
select
a POP from the map and then select one of the hyperlinks in the popup
-
select
a hyperlink from the POP List
Both of the
above two ways are shown below.
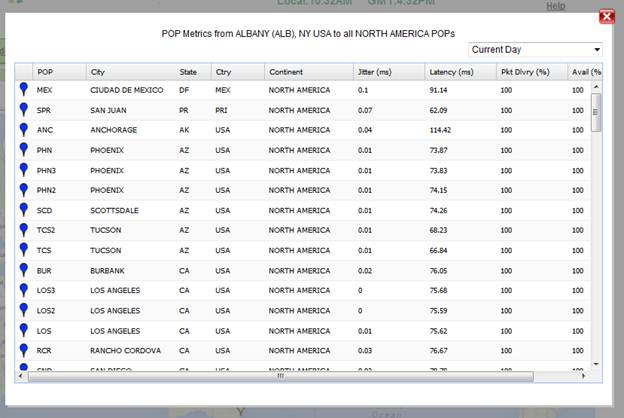
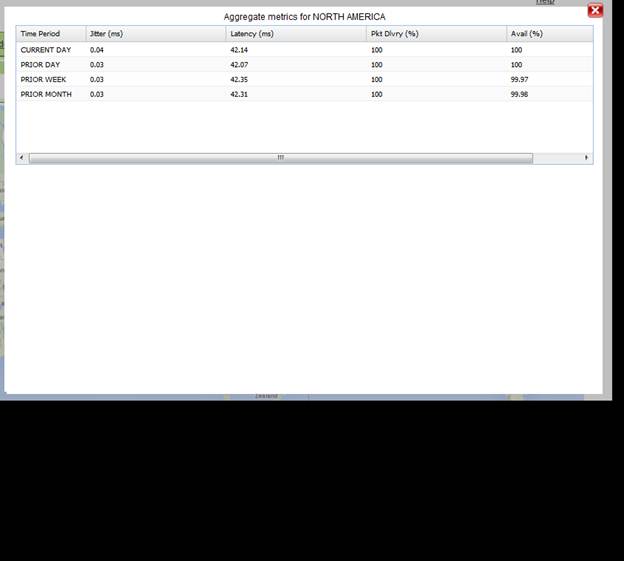
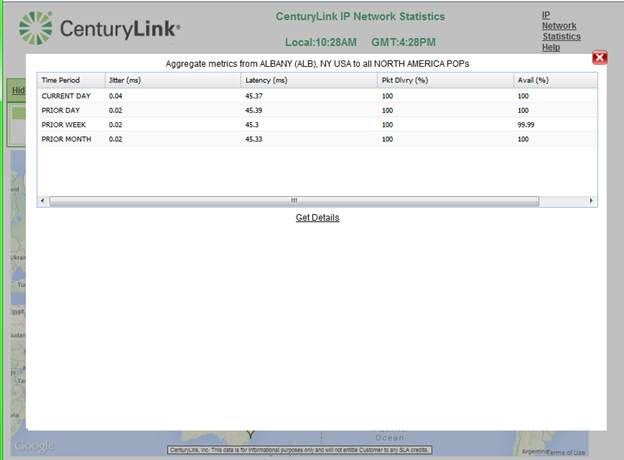
After a
hyperlink is selected from either the map popup or the POP list, the following
screen shows. This example screen selection shows the
aggregate metrics for Albany, NY
to all other North America POPs. The detailed metrics (individual metrics for
the Albany, NY
POP to each
and every other North America POP are shown by selecting the “Get Details”
link.
The following
shows an example of the detail metrics screen.
Each of the columns is
sortable by accessing the column title.